The Big Data Blog
  • Home
  • Blog
  • About
  • Contact
  • Subscribe

Dimensions of Data Quality

4/20/2015

0 Comments


Overview

Data Quality is an integral part to any system that deals with data. The quality, reliability and usability of data is paramount to its value. Unfortunately, data quality issues run all too rampant within the data infrastructure of an organization. To be able to correlate data quality issues to business impacts, one must be able to classify data quality exceptions and assess the impact. As such, one of the most valuable exercises when implementing a data quality solution is to profile the data across the four common dimensions of data quality

Dimensions

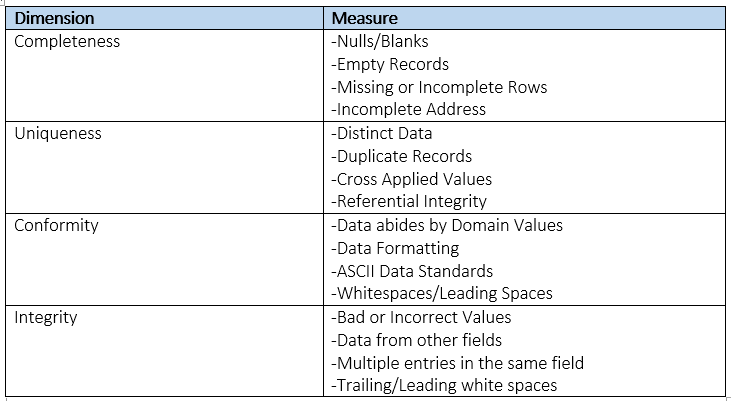
1. Completeness
Determination of what data is missing and incomplete. Checks in this areas identify what data values are missing or are in an unusable state. The incompleteness of data can be a result of omitted records, accidental deletion or non-required fields. Completeness can be critical to business processes and the accuracy of information.
2. Uniqueness
Determination if data is deduplicated and unique. Checks in this areas identify duplicated data. The uniqueness of data can be a result of merged systems, data re-entry and multiple source systems. Uniqueness is a key functionality of Master Data Management and data sharing across an organization
3. Conformity
Determination if data abides by the standards of the organization and industry regulations. Checks in this areas identify what data values do not conform to integrity, column or row formatting/standards. The non-conformity of data can be a result of non enforced data standards, imported data from unstructured sources or lack of data integrity constraints. Conformity can be vital to the usability and sharing of data across platforms.
4. Integrity
Determination if data is corrupted or decayed. Checks in this areas identify what data values are include erroneous, incorrect and junk information. Bad data can be a result of non enforced data standards, dummy data left in the system and lazy data entry. Integrity is very important to the reliability, accuracy and usability of data in key business processes.

Measures
Picture
​

0 Comments

Self Service Business Intelligence (BI)

3/21/2015

5 Comments


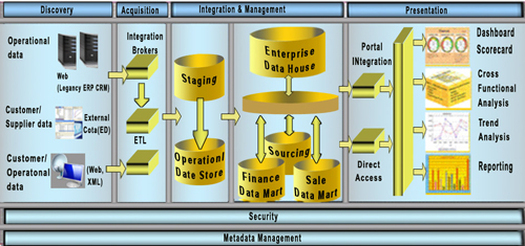
Traditional BI Life-cycle

Picture

Challenges

In the past the traditional BI development life-cycle worked well because of the size and end usage of data. With the new paradigm shift in the way enterprises gather, analyze and need data there are many challenges with using traditional methods.

Scattered Data: Data needed to make key business decisions is scattered through the organization. It resides within applications, data warehouses, databases, departmental levels and organizational groups. Traditional BI struggles in this area because it requires data to be gathered, cleansed and consolidated in one central location. 

Pace of Business & Data: The needs and direction of a company can change very quickly and without warning. The pace of business and data now moves at lightening speed and requires BI at a speed to match. Traditional BI cannot maintain an agility of growth because of the ramp up time needed to gather new data, create a new report or run a new set of analysis

Big Data: Big Data bring new velocity, volume and variety of data which far exceeds the past. This information holds key information, needs to be analyzed and is an integral part to decision making. Traditional BI is based on tabular data models and relational data stores. It is unable to gather, process or analyze any type of data that is not structured.

Real Time Analytics: Big Data provides data at very high volumes and speeds. There is a big need to analyze this data at a similar velocity to generation so that insights are fresh and actionable in real-time. Traditional BI takes time to on board new sources and churn through large amounts of data. There is a substantial lag in terms of days, weeks or even months before data makes it through the pipeline into a report.

Development Time: With all of the challenges identified above the common denominator is development time. Traditional BI takes a lot of time to add, modify, change or remove features/data/reports due to its architecture. It can be days, weeks or even months before a new requirement is actualized. 

New Requirements

Real Time Analytics: Big Data provides data at very high volumes and speeds. Companies need to analyze this data at a similar velocity to generation so that insights are fresh and actionable in real-time. Making decisions on stale or old data cannot be allowed because of it can negatively impact on competitive advantage.

Data Science: Big Data has provided a wealth of untapped information. Companies are now realizing that this data needs to be extracted, analyzed and used in order to effectively make good business decisions. Data Scientists are being hired all over the industry and as such they need platforms that can grant them access to this data as well as support any complex statistical analysis they will subject the data to.

Easy to Use Tools: The new analysts and end users of data have now shifted to the business side. Since they do not have a technology background they require tools and technologies that are easy-to-use and intuitive. Easy tools also reduce time spent of learning, training and navigating through functionality which means more time can be spent on the analysis and reporting of information to make key decisions.
 
Speedy "Time to Data":
Along with easy to use tools, analysts and end users require tools and technologies that will allow them to connect to data all across an organization as well as external sources. They need this data to become readily available with limited lead time so that analysis can be performed when necessary. 

Internal & External Data:
Companies are now vastly interconnected systems. As a result the decisions being made can impact multiple areas of an organization. This has created a need to gain access to internal and external data. If a data source exists that contains key information vital to making decisions, tools and technologies must provide a method to extract and analyze that data with no/limited boundaries.

Self Service BI

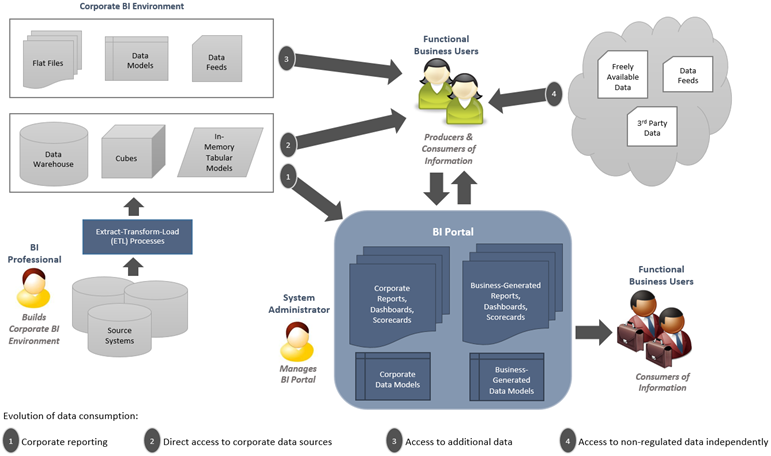
Self Service Business Intelligence is a paradigm sift in the way business gather, analyze and use their data. It enables end users to combine and analyze data from inside and outside the organization to achieve faster and better decision making across the enterprise. This is achieved through adopting a new methodology towards Business Intelligence development as well as new tools and technologies.
Power Query: Microsoft Excel add-in that provides functionality to discover, extract, combine and import data from traditional relations data sources as well as unstructured data sources (HDFS, Blob Storage, HDInsight). Power Query enables users to query and pull data from internal and external data sources.

Power Pivot:
Microsoft Excel add-in that 
provides functionality to import large data sets from multiple sources, build data models and run analysis. Power Pivot enables users to gather, store and analyze large amounts of data from multiple sources..

Power View: Microsoft Excel add-in that provides data visualizations, reports and dashboard functionality to visualize and present data. Power View enables users with limited technical knowledge to create ad-hoc and modify reports.

Tableau: Software that provides functionality to import data from multiple sources, transform and build data models and produce visualizations/dashboards. Tableau stands as a combination of ETL and data visualization products.

Alteryx: Software that provides functionality to import data from multiple sources, and run complex analytic functions. Alteryx stands as a combination of ETL and analysis products.

Web Focus Info Discovery: Web-based tool that provides functionality to import data from multiple sources, transform and build data models and produce visualizations/dashboards. Tableau stands as a combination of ETL,analysis and data visualization products.

Power BI Tools & Technologies

Self Service BI Life-cycle

Picture
5 Comments

      Subscribe

    Subscribe

    Categories

    All
    Bi
    Big Data
    Cassandra
    Cloud
    Column Store
    Data Quality
    Flume
    Hadoop
    Hardware
    HDFS
    Hive
    IPaaS
    MapReduce
    MPP
    NoSQL
    Pig
    Self Service BI
    Semi-Structured
    SEO
    SMP
    Structured
    Unstructured
    Virtualization
    VMware
    Web

    Archives

    July 2016
    June 2016
    May 2016
    March 2016
    February 2016
    December 2015
    August 2015
    May 2015
    April 2015
    March 2015
    October 2014
    September 2014
    July 2014
    April 2014
    March 2014


    RSS Feed


    Disclaimer
    All content represented in this blog is that of the owner. They do not represent any connection with Apache, HortonWorks, Cloudera or any other company. This blog does not claim ownership of any of the content as original thought. This blog will not be held accountable or take any responsibility for any content. All views and recommendations are based upon the opinion of the owner.

Powered by Create your own unique website with customizable templates.