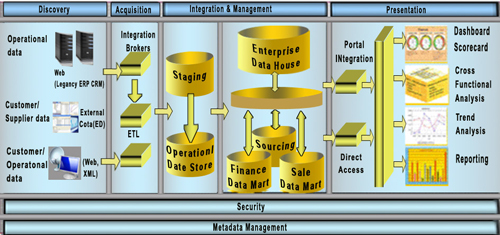
Traditional BI Life-cycle
Challenges
In the past the traditional BI development life-cycle worked well because of the size and end usage of data. With the new paradigm shift in the way enterprises gather, analyze and need data there are many challenges with using traditional methods.
Scattered Data: Data needed to make key business decisions is scattered through the organization. It resides within applications, data warehouses, databases, departmental levels and organizational groups. Traditional BI struggles in this area because it requires data to be gathered, cleansed and consolidated in one central location.
Pace of Business & Data: The needs and direction of a company can change very quickly and without warning. The pace of business and data now moves at lightening speed and requires BI at a speed to match. Traditional BI cannot maintain an agility of growth because of the ramp up time needed to gather new data, create a new report or run a new set of analysis
Big Data: Big Data bring new velocity, volume and variety of data which far exceeds the past. This information holds key information, needs to be analyzed and is an integral part to decision making. Traditional BI is based on tabular data models and relational data stores. It is unable to gather, process or analyze any type of data that is not structured.
Real Time Analytics: Big Data provides data at very high volumes and speeds. There is a big need to analyze this data at a similar velocity to generation so that insights are fresh and actionable in real-time. Traditional BI takes time to on board new sources and churn through large amounts of data. There is a substantial lag in terms of days, weeks or even months before data makes it through the pipeline into a report.
Development Time: With all of the challenges identified above the common denominator is development time. Traditional BI takes a lot of time to add, modify, change or remove features/data/reports due to its architecture. It can be days, weeks or even months before a new requirement is actualized.
New Requirements
Real Time Analytics: Big Data provides data at very high volumes and speeds. Companies need to analyze this data at a similar velocity to generation so that insights are fresh and actionable in real-time. Making decisions on stale or old data cannot be allowed because of it can negatively impact on competitive advantage.
Data Science: Big Data has provided a wealth of untapped information. Companies are now realizing that this data needs to be extracted, analyzed and used in order to effectively make good business decisions. Data Scientists are being hired all over the industry and as such they need platforms that can grant them access to this data as well as support any complex statistical analysis they will subject the data to.
Easy to Use Tools: The new analysts and end users of data have now shifted to the business side. Since they do not have a technology background they require tools and technologies that are easy-to-use and intuitive. Easy tools also reduce time spent of learning, training and navigating through functionality which means more time can be spent on the analysis and reporting of information to make key decisions.
Speedy "Time to Data": Along with easy to use tools, analysts and end users require tools and technologies that will allow them to connect to data all across an organization as well as external sources. They need this data to become readily available with limited lead time so that analysis can be performed when necessary.
Internal & External Data: Companies are now vastly interconnected systems. As a result the decisions being made can impact multiple areas of an organization. This has created a need to gain access to internal and external data. If a data source exists that contains key information vital to making decisions, tools and technologies must provide a method to extract and analyze that data with no/limited boundaries.
Self Service BI
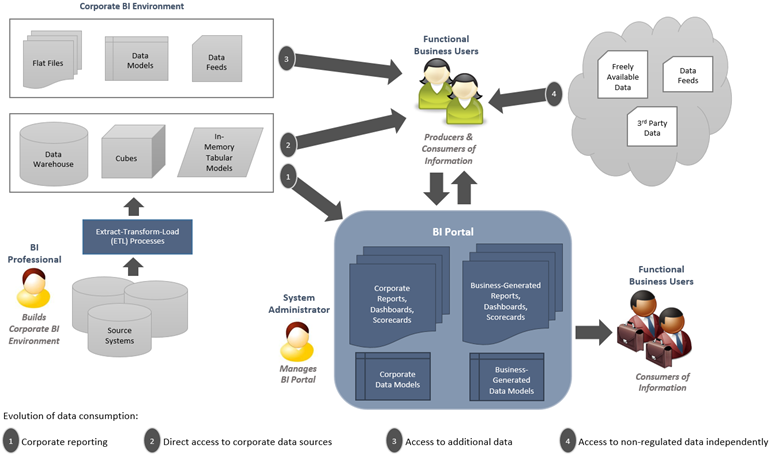
Self Service Business Intelligence is a paradigm sift in the way business gather, analyze and use their data. It enables end users to combine and analyze data from inside and outside the organization to achieve faster and better decision making across the enterprise. This is achieved through adopting a new methodology towards Business Intelligence development as well as new tools and technologies.
Power Query: Microsoft Excel add-in that provides functionality to discover, extract, combine and import data from traditional relations data sources as well as unstructured data sources (HDFS, Blob Storage, HDInsight). Power Query enables users to query and pull data from internal and external data sources.
Power Pivot: Microsoft Excel add-in that provides functionality to import large data sets from multiple sources, build data models and run analysis. Power Pivot enables users to gather, store and analyze large amounts of data from multiple sources..
Power View: Microsoft Excel add-in that provides data visualizations, reports and dashboard functionality to visualize and present data. Power View enables users with limited technical knowledge to create ad-hoc and modify reports.
Tableau: Software that provides functionality to import data from multiple sources, transform and build data models and produce visualizations/dashboards. Tableau stands as a combination of ETL and data visualization products.
Alteryx: Software that provides functionality to import data from multiple sources, and run complex analytic functions. Alteryx stands as a combination of ETL and analysis products.
Web Focus Info Discovery: Web-based tool that provides functionality to import data from multiple sources, transform and build data models and produce visualizations/dashboards. Tableau stands as a combination of ETL,analysis and data visualization products.
Power BI Tools & Technologies
Self Service BI Life-cycle
 RSS Feed
